Advanced techniques for users who have mastered the basics.
Pick and choose the topics of interest
Power BI navigation - Navigation has quite a bit of impact on use adoption.
Navigation can be as simple as organizing the reports in an APP to drilling to pages or other reports, or using bookmarks to tell a story with data.
Apps support customized navigation Apps are a package of reports and dashboards that can be distributed. Apps have more navigation customization like hiding reports, custom sections and external links. It is a best practice to distribute reports via APPs.
Button navigation - Actions Buttons are icons or images that can be placed on a PBI report, these buttons support a number of actions like Q+A, drill through, call a bookmark, etc.
Bookmarks - Storytelling and some Use case examples Bookmarks are saved report states including filter and slicer selections.
Drill to page and Drill buttons and some Walk through Drill to page allows you to jump to a new page in the report and pass in your current selection. Often the target page is hidden, and a navigation button allows for a return back to the originating page.
Cross drill - drill to new report and video walkthrough While Drill to page allows a user to jump to another page in the report, cross drill allows the user to jump to a different report.
Data security - Restricting access to a subset of the data based on the user
Basic Row Level Security -RLS and walk through
Remember that users with RW access to the workspace (Admin, Contributor or Member) will NOT have RLS rules applied. As editors, they could remove themselves from the role so security is not applied. It is a best practice to distribute content via APPs and not the workspaces. APPS
For reuse of security rules across Power BI datasets, an approach called Table driven security can be utilized. This is a more complex technique but makes management and reuse of rules much easier.
Dynamic security
More Dynamic security
Information protection - This is the ability to apply data protection labels so exported content can be secured! Overview of information protection This entire section of the document is worth reviewing Video overview
Application Lifecycle - Application lifecycle allows you to move PBI content between Development, UAT and Production workspaces. Think of this as no code devops! Power BI ALM is a Premium feature. Introduction Walkthrough Getting started
3rd party tools - Power BI has always been an open and extendable product. Custom data connectors and custom visuals have allowed people to extend the product in many new ways. With Power BI Premium, we have new ways to connect with developer tools. These are some of the most popular tools.
While Premium is required to connect to the Power BI service, Premium is not required for use with the Desktop files.
Microsoft’s description
ALM toolkit Used to compare 2 PBI files or PBI content in the cloud
Tabular editor free or commercial license
Tabular editor best practices analyzer This uses a set of rules to analyze your Power BI data set and identifies possible improvements.
Dax Studio If you are writing a lot of Dax this can be a huge asset but it also has the ability to export data, and metadata from your model.
Exporting metadata - VPAX files The file exported is a VPAX file and we can use the
Vertipaq Analyzer to view the data. See the walkthrough and class. Note the class covers several third party tools.
Or you can view the JSON of the vpax file Walkthrough
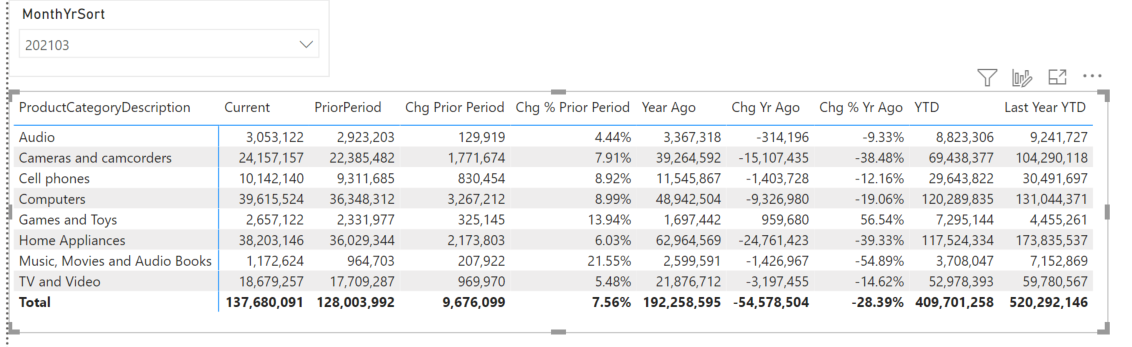
Calculation groups Power BI has a powerful calculation language called DAX. Often we are required to create the same calculation several times for each metric. If you have Sales and Returns data, you might have YTD, Last YTD, Prior Month, Year ago for each measure.
Calculation groups allow you to create a calculation like YTD but apply it to several measures.
While this is an advanced feature and requires use of a 3rd party tool Tabular Editor(see above)
Calculation groups do require a good knowledge of DAX
Composite models
Composite models are simply put the ability to mix Imported and Direct Query data, or to mix more than one Direct Query data source in the same model.
Overview of Composite models
Composite models open up some wide ranging design options when using Direct Query data models or Live Connections.
Composite models also support Aggregations - a mix of imported and direct query data in the same dataset. Aggregates can greatly improve performance on large datasets while leaving all the detail level data available to the users.
Refer to this section on data modeling
Query Folding
Query folding is critical enough and misunderstood enough that it is repeated here. See Data modeling section on this
Detailed walkthrough
This article mentions “At the time of writing this post Merge Columns doesn’t support Query Folding. I have reported this to Power Query Team, and they are working on it, to solve the issue.”
Power BI and Power Query is under constant development so transformations that don’t allow for query folding can and will change.
*Useful links and articles How to determine if Query Folding is happening? The unofficial guide to Query Folding Multipart article on Query Folding Where should I prepare my data Really read this - you can do a lot in Power Query to prepare data but pushing the prep back to the source system will save you time, and resources.